This project accesses social media, scans for natural event impacts on transportation infrastructure, cues collection of satellite, air or ground imagery and then makes the imagery available as open data services. The purpose of the project is to use social media such as tweets to target collection of imagery that can answer the question, “What’s the impact of natural events on transportation infrastructure conditions?” Significant applications and services developed are previewed below.
Carbon Scanner Application
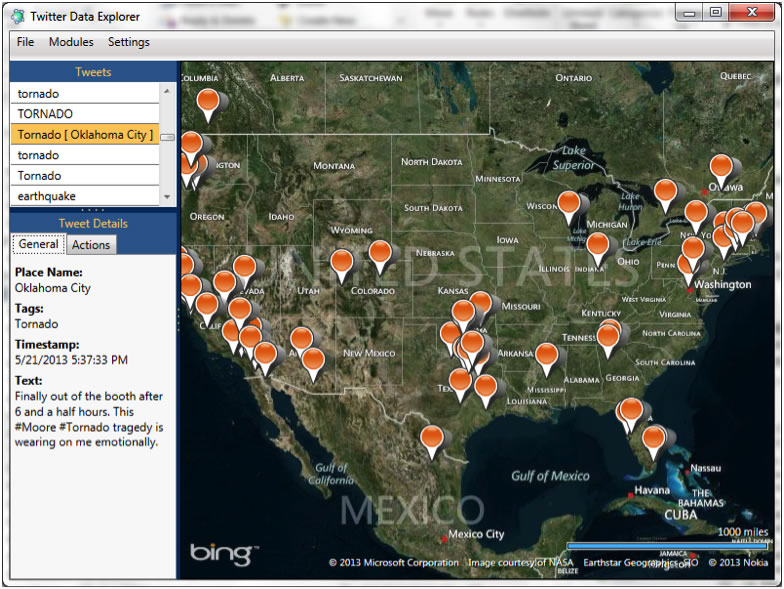
As part of this project a Carbon Scanner application was developed to browse Tweets, review ‘Alerts’ with significant activity and help cue collection of satellite, air or ground imagery. Examples are shown below.
Browsing tweets over the US in the Carbon Scanner application
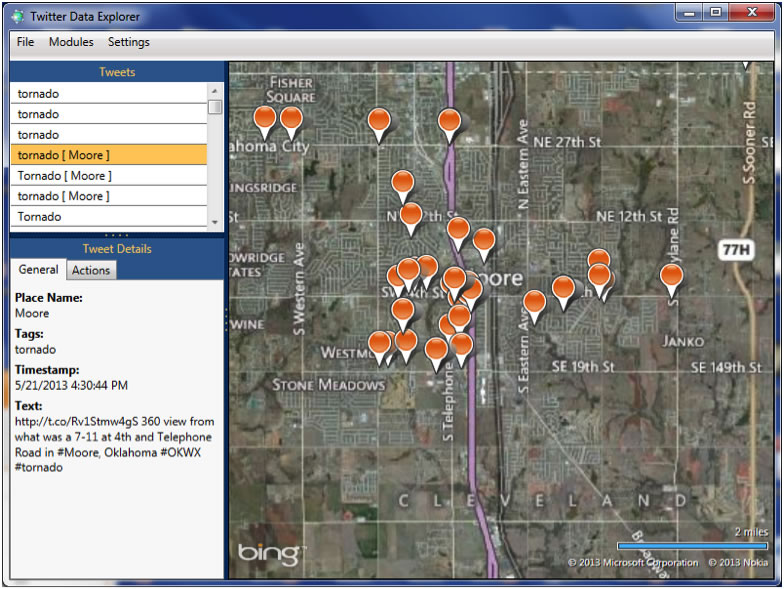
Browsing tweets over Moore, OK using the Carbon Scanner application. Reviewing a Tweet identified over Moore, OK in a web browser launched from the Carbon Scanner application
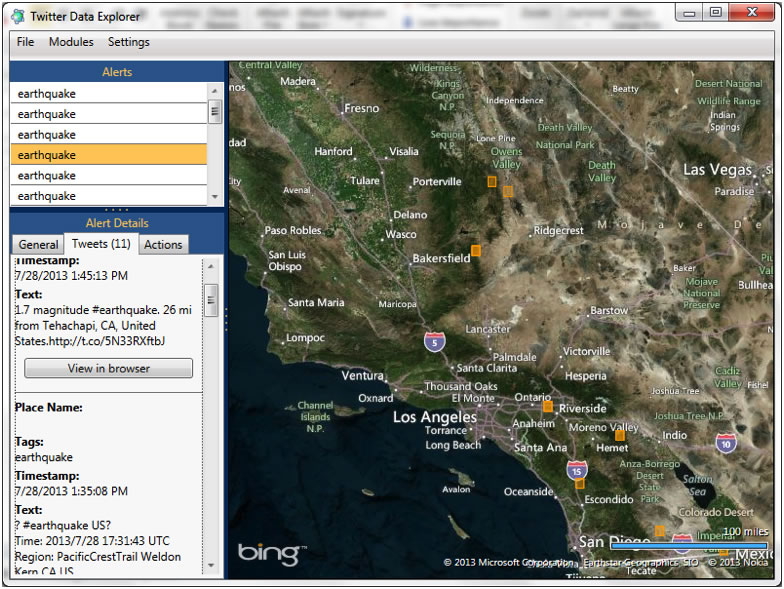
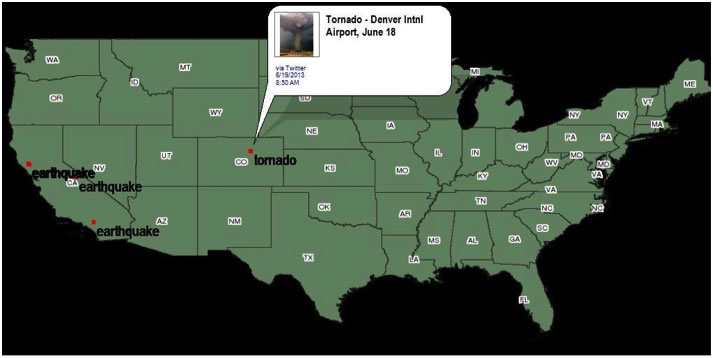
Reviewing Earthquake Alerts over Southern California
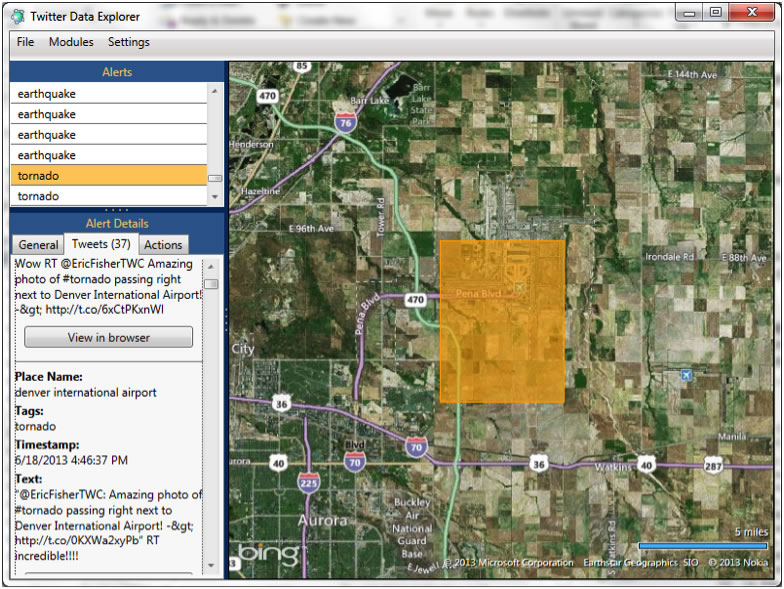
Reviewing a Tornado Alert over Denver International Airport
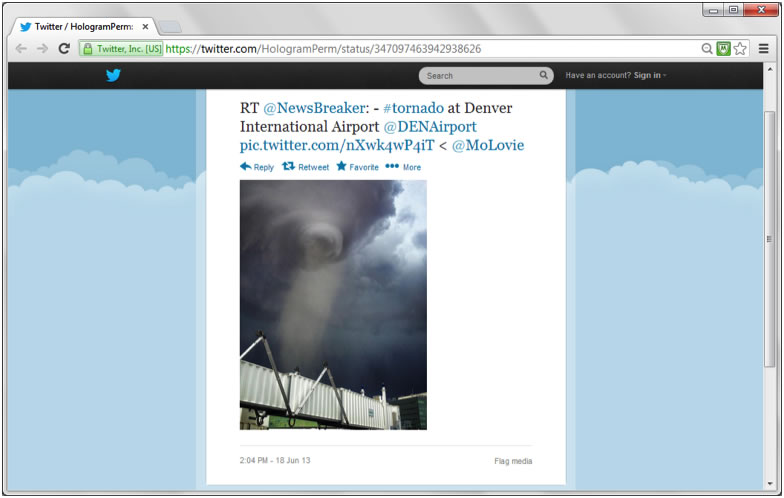
Reviewing a Tweet for a Tornado reported over Denver International Airport
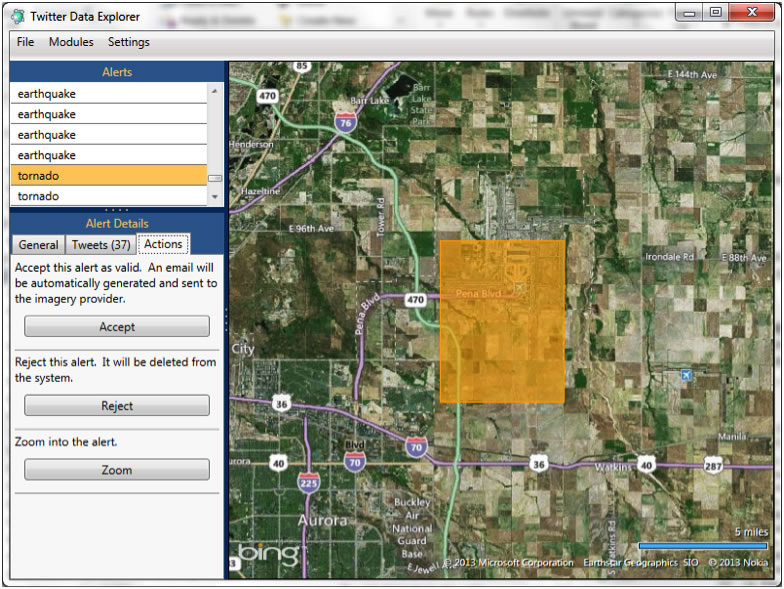
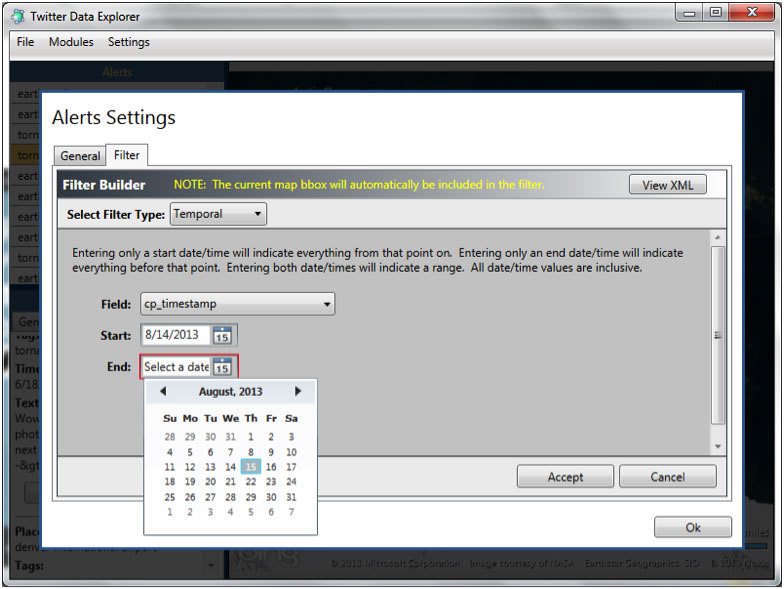
Assessing Tornado Alert over Denver International Airport. If Accepted, imagery may be cue’d for collection.
Adjusting Filter settings for Alerts in the Carbon Scanner application
Carbon Scanner Services
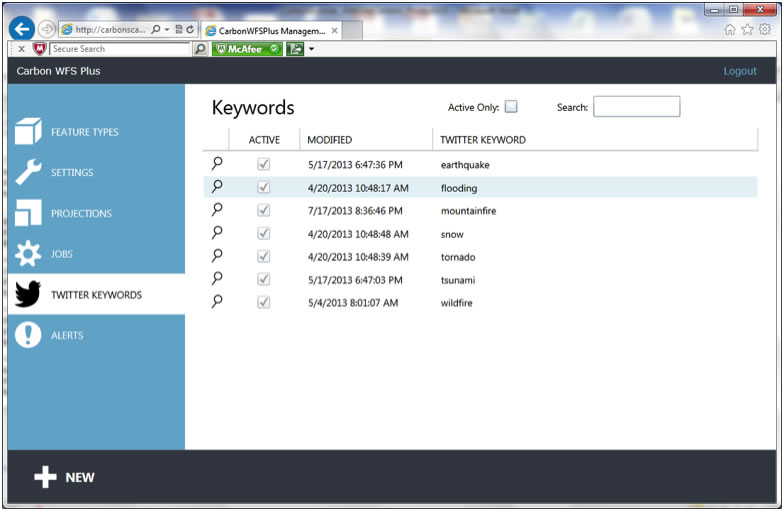
The Carbon Scanner service is responsible for reviewing real-time information by keyword, locating road, bridge and other condition reports and assessing the impact of natural events on transportation infrastructure conditions. As events happen, the service ‘scans’ the United States each hour to assess and generates Alerts on areas with significant activity. System settings are managed by a portal service which enables manager-level users to quickly adjust keyword and other settings. Examples are shown below.
Managing Keywords for Carbon Scanner alerting
Data is processed by the Scanner Service using 10x10km Alert Boxes. The Alert Box is the size of the area we assess to see if tweets fall in the region - so the network can consider requesting imagery over the reported area. The United States area is covered by Alert Boxes during scanning, and a representational graphic of the scanning process is shown below.
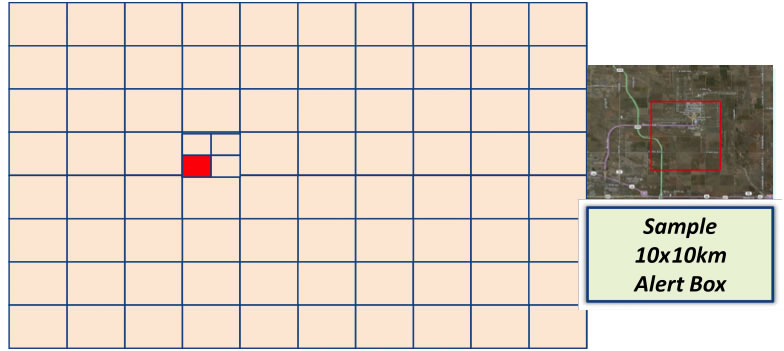
The 10x10 km Alert Box size was determined to be most efficient because - • Many urban areas significant transportation infrastructure are approximately10x10km (100km2) to 20x20km (400km2) in area. For example, a 10x10km Alert Box is roughly the size of Staten Island, or a city like Moore, OK. • The minimum ordering area for DigitalGlobe satellite imagery in 100km2. The Carbon Scanner was deployed on the cloud and set to run once an hour with a selected match minimum of reports in each Alert Box. A sample Alert layer from the Carbon WFS+ rendered in the Gaia GIS application is shown below for the United States. The background map is provided by a Web Map Service (WMS) using National Spatial Data Infrastructure (NSDI) Framework Data.
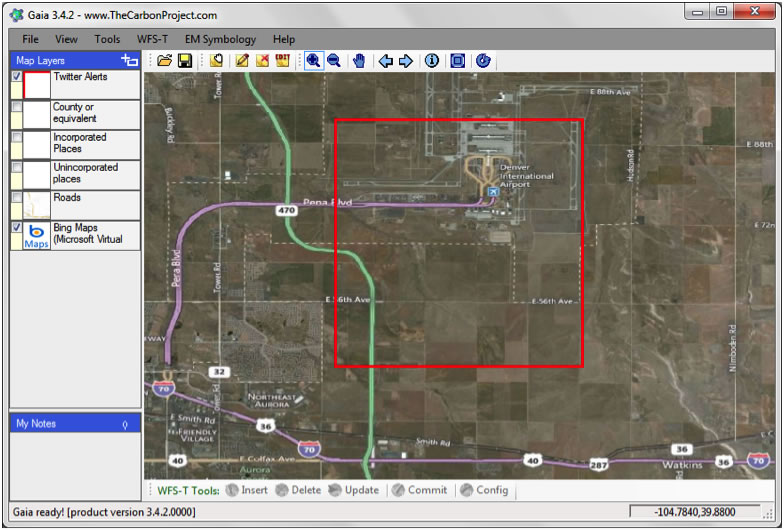
A closeup of the 10x10km Alert Box for Denver International Airport, in Geography Markup Language (GML) from the Carbon WFS+, is shown below as an output layer in the Gaia GIS application overlayed on Bing Maps with other Framework Data information available to support assessment of infrastructure conditions.
Once a potential natural event impact on transportation infrastructure was identified by the Carbon Scanner imagery was cue’d for collection by DigitalGlobe satellites. When the data is available, it is deployed in seconds using OpenImageMap services and made available as open mapping services including OGC WMS, Web Map Tile Services (WMTS), Web Coverage Services (WCS), Google Maps API, Google Earth KML overlays and OSGeo TMS. This approach ensures rapid deployment of imagery and open access to imagery data. System settings are managed by a portal service which enables manager-level users to quickly add imagery, and manage services and access controls. Examples are shown below.
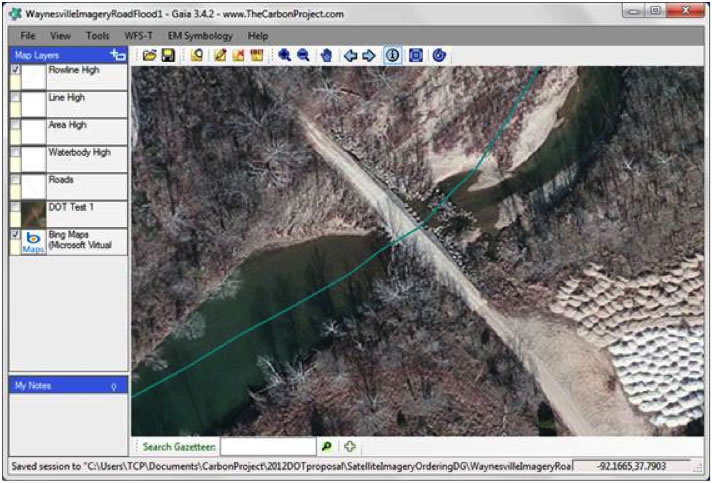
Imagery collected by DigitalGlobe over Waynesville, MO on Aug 8 deployed as an interoperable Web Map Tile Service
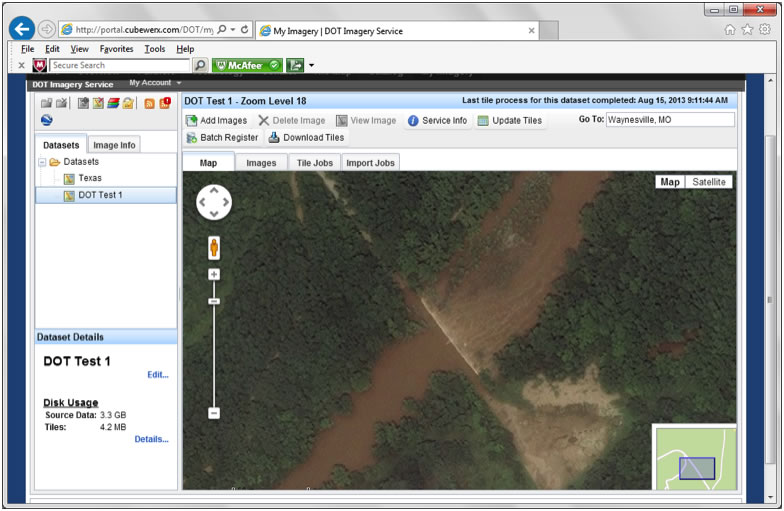
Source data from DigitalGlobe over Waynesville, MO
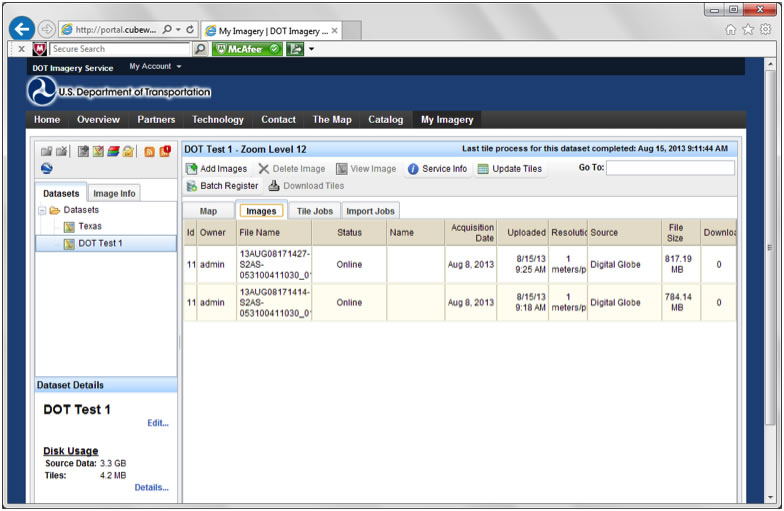
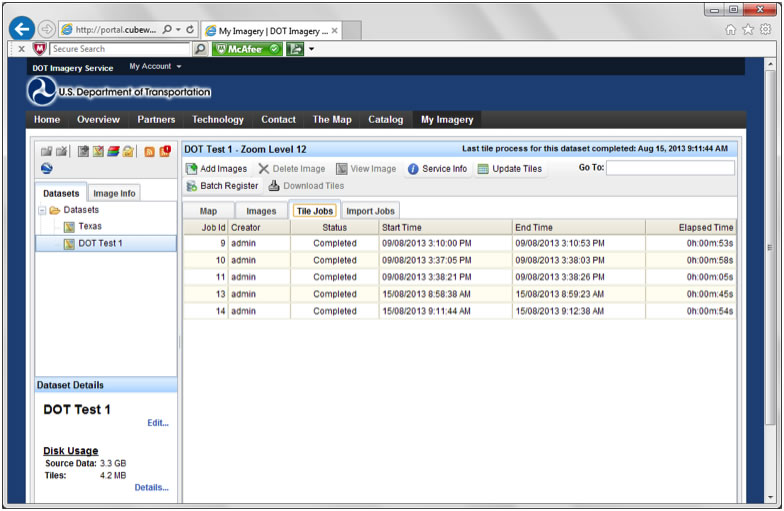
3.3 GB of satellite imagery was tiled in 54 seconds and deployed simultaneously as Google Maps API, Google Earth KML overlays, OGC WMS, WMTS, WCS and OSGeo TMS for access by GIS applications
GIS Applications
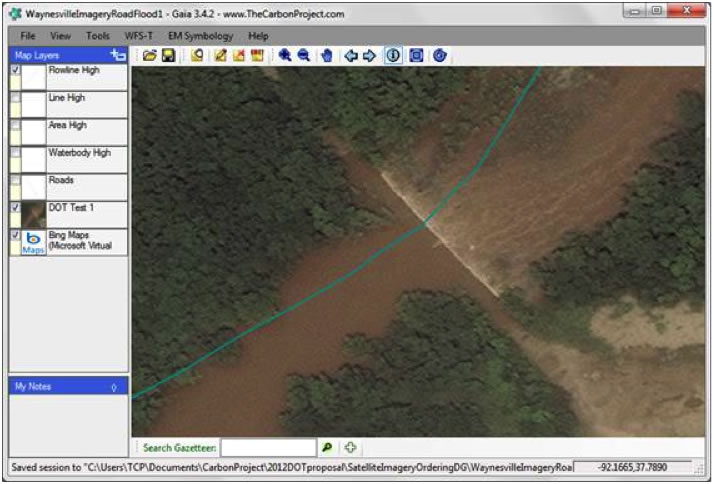
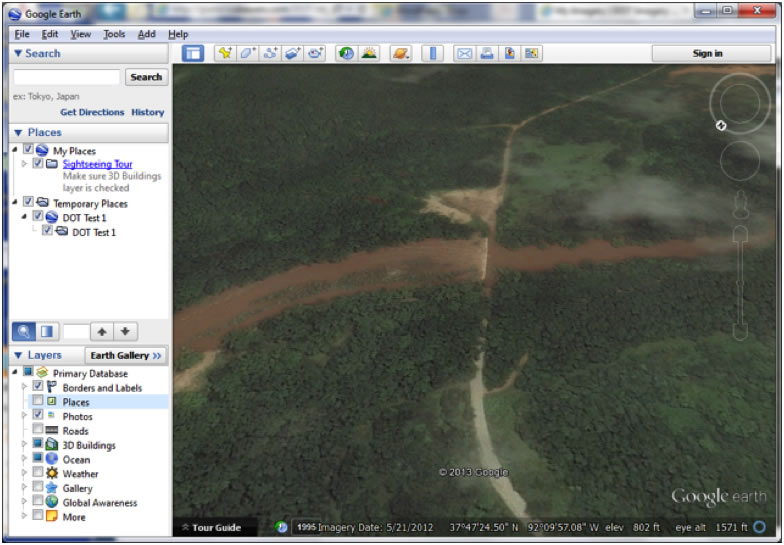
Since the Carbon Scanner Services and Imagery Services are based on open standards for interoperability a variety of GIS applications can access the information. Examples of imagery service access are shown below. Alert access was shown in previous sections. Imagery from DOT Imagery Service, collected by DigitalGlobe on Aug 8, showing flooded road near Waynesville, MO in Google Earth
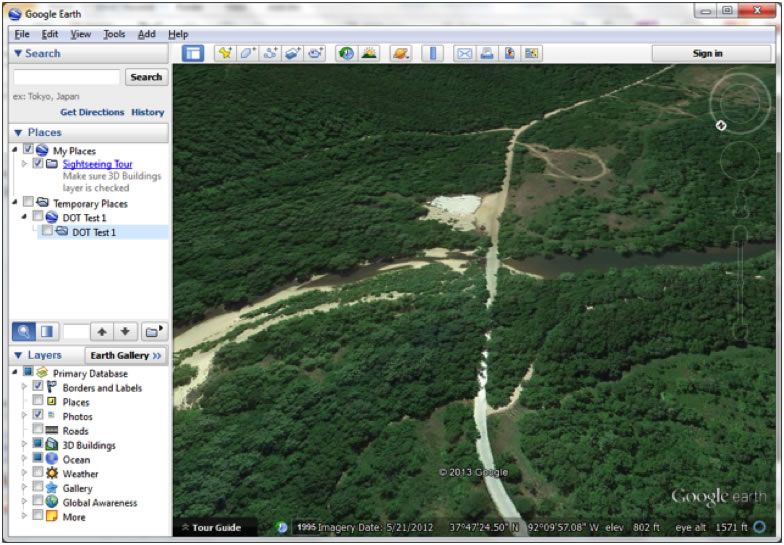
The same Waynesville, MO road on a ‘normal’ day using background Google Earth imagery.
Imagery may also be accessed by the WMS standard, and combined with NSDI Framework Data in any GIS supporting this popular standard. The Gaia application is shown below with the ‘Before’ imagery from Bing Maps and the ‘After’ imagery from the DOT Imagery Service displayed.